Stage 33.4PageResearch
Value Based Coding and Design
Analyze Data and Create First Map Draft · Prepare to Analyze Data and Draft Map
Coding Data
Coding is a term used to describe finding common themes from a group of qualitative (non-numerical) data. For the sake of this course, we will use the term coding to mean the process by which we make sense of the youth and adult data to determine what content will be included in the CFC map, what descriptors will be attached to that content, and how that content supports youth and families to have greater access to the spaces that are important to them in their community.
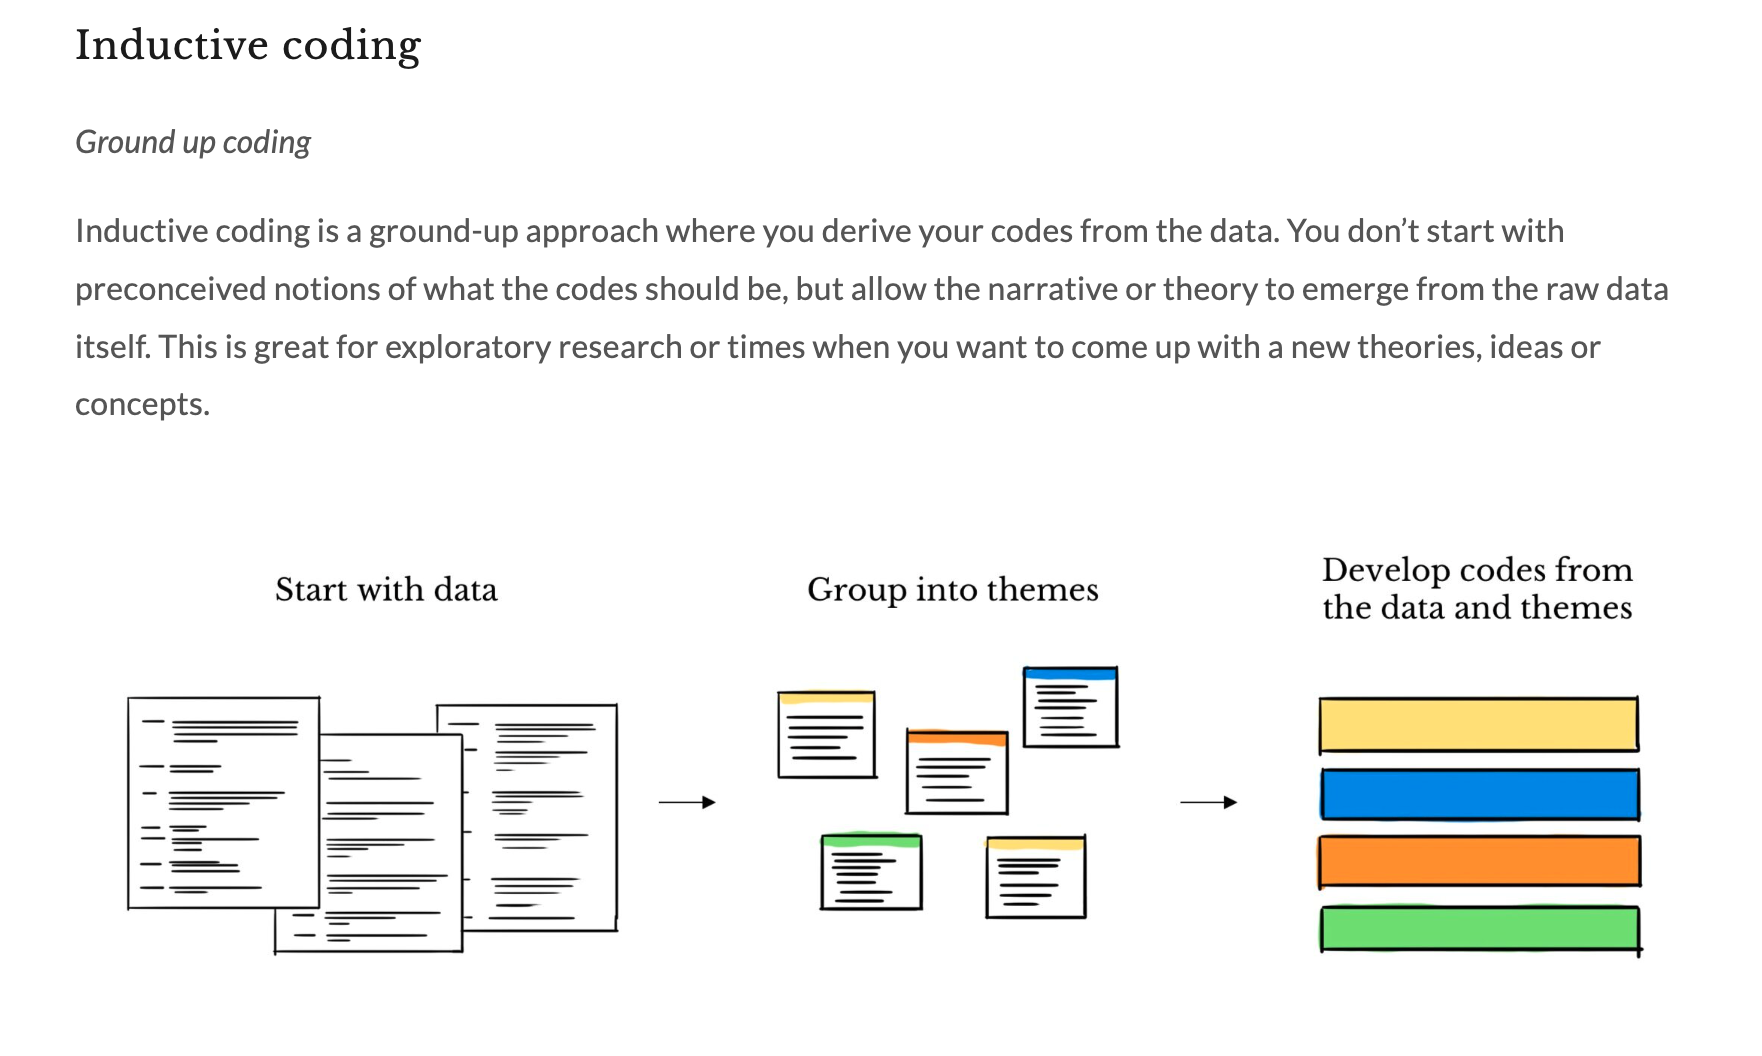
If you want to know more about what coding means in qualitative analysis, here is a helpful website. The website offers two visuals that can help with the coding you’ll do with youth and adult data. The first describes inductive coding, or a process by which you determine different codes or categories after looking at the data. For our purposes, this would be more relevant when looking at the Favorite Place data and Map Elements data that is generated from Lesson 1 engagements with your partners. From the data generated by those activities, you might begin to group the Map Elements into common themes, such as “having a key” or “including student drawings.” Similarly, when you are asking your partners to categorize Favorite Places, they may come up with different categories such as “Public Spaces”, “Private Spaces”, “Free Spaces”, “Educational”, or “Outdoor Spaces.” When we began our own map making process, we didn’t know what the final categories would be, so we went through several cycles of determining common themes and categories (codes) and then narrowing them down. This process is considered inductive coding.
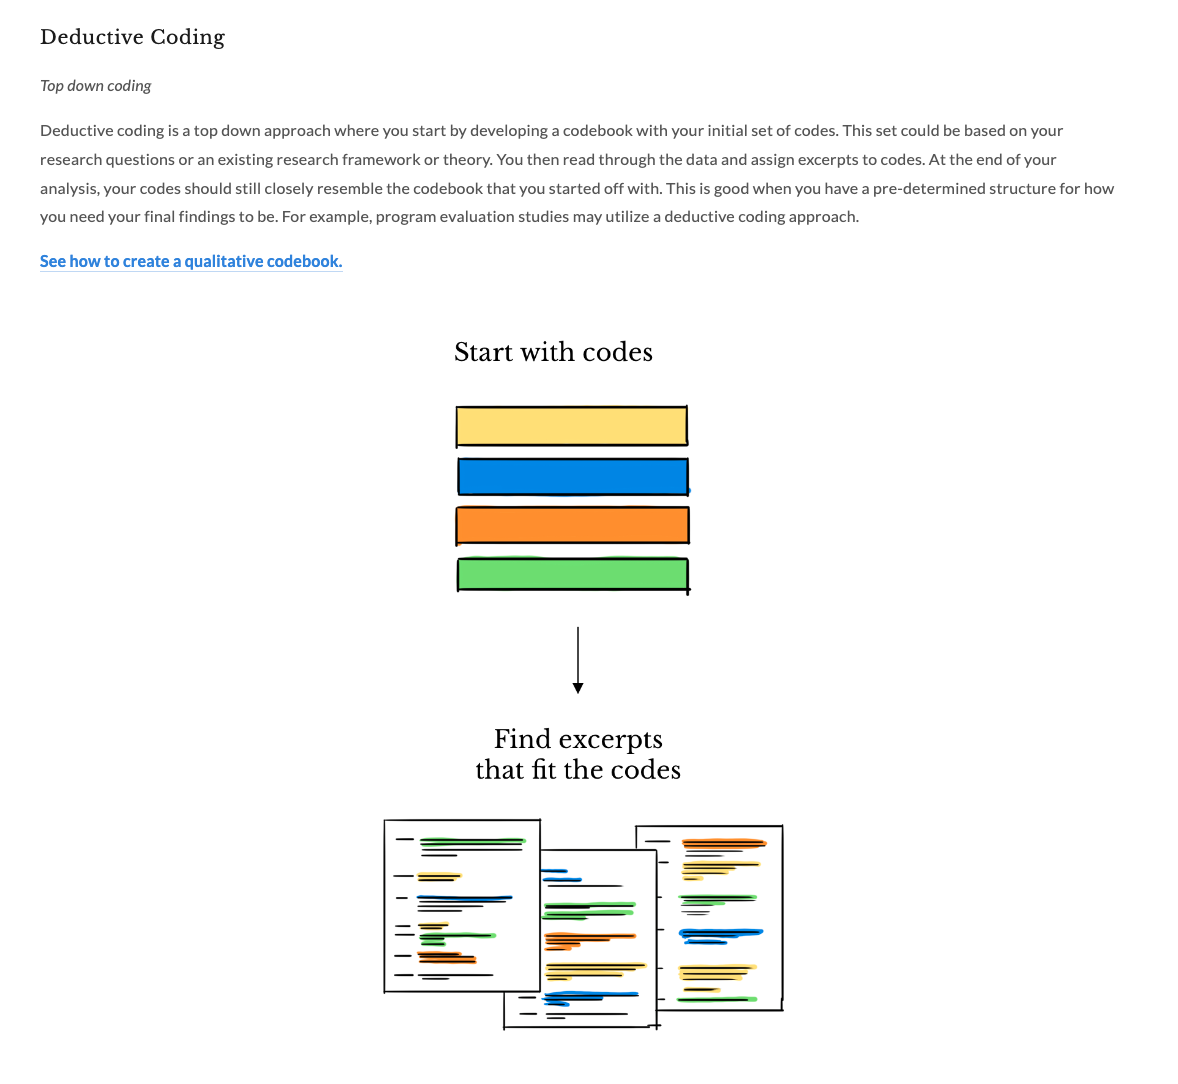
The second helpful visual describes deductive coding, or the process by which you sort data into pre-determined categories. Because you have the benefit of learning from our experience creating a CFC map, you can utilize deductive coding by using the categories we used in our final CFC map, if you so choose. When looking at favorite places, you could sort the favorite places into the categories that we have provided: Arts/Culture, Education, Nature/Trails, Parks n’ Play, Sports Field, Water Play, Retail, Food. However, keep in mind that these are codes that make sense for OUR community. You may choose to code things in an entirely different way (ie. sorting favorite places into age-appropriate locations). Likely, even if you start with deductive coding, you will want to go back through the data and do a round of inductive coding to see if other codes/categories are arising based on your own city’s location, values, and family-focused spaces.
Value Based Coding
It’s important to note that how you sort and analyze the youth data is reflective of the values that you want to emphasize in the creation of a CFC map. For example, when sorting our data, we chose to separate fee and no fee favorite places. This allowed us to practice the value of equity, ensuring that the spaces highlighted on the map were available to all, regardless of financial status.
Before you begin to code your data as outlined in 3.5 | 🖐🏽 Analyze Youth Notecatchers , 3.6 | 🖐 Analyze Youth Favorite Place Drawings, 3.7 | 🖐🏽 Analyze Caregiver Surveys we encourage you to ask your coding team value-based questions ie. Will you place for-pay places on the map? Will you show all of the schools? What should side 2 look like? Will the map be bilingual? Asking these questions will bring you back to the values that come out of the conversations with young people and the specific ideas that come from what they want in a map. You will also consider your own values and the values of the adults involved with this project. Remember, what you choose to include in the map is reflective of the values your community holds. A map that shows all of the libraries in town, for example, might be celebrating the value of free public spaces, learning, education, and culture.