
Stage 33.5PageCreate
Analyze Youth Notecatchers
Analyze Data and Create First Map Draft · Analyze Data from Partner Engagments

Data from Youth Notecatchers
After collecting the data from your partners and having them enter the data into the spreadsheets, or entering it yourself, you will analyze the data to understand what are the most common things that youth are saying they want in a map. In GUB CFC Map Engagement Data we have created an example spreadsheet to walk you through the data analysis steps you might take to analyze youth data. Below, we have outlined all of the steps we took to analyze the Map Elements data which was generated by students completing Activity 1 in Lesson 1. Follow the steps below, and explore the spreadsheet to see how you might narrow down large amounts of data into manageable chunks.
Generate and Populate Your own Map Engagement Data Spreadsheet
- Go to the Your Templates folder on Google Drive and ensure that you have saved a copy of all of the documents within to your own Google Drive folder.
- Once you have, open CFC Map Engagement Data Template.
- Utilize the steps below to populate and analyze your own Map Engagement Data.
Steps to Analyze Notecatchers: Map Elements Data | |
| Here we have given you an overview of the steps involved in collecting, organizing, and analyzing the notecatchers data which will contribute to the creation of a child-friendly city map. At the core of creating this map is listening to youth and children, so how you handle youth data is central to ensuring their ideas are centered in this process. | |
| Step 1: | Partners lead Lesson 1 with children and youth and collect notecatchers generated from Activity 1. |
| Step 2: | Partners add photos of notecatchers into their corresponding google drive folders |
| Step 3: | We have offered two possible steps here: Option 1 is intended for you as the map makers to sort ALL of the data generated by the partners into this Data Workbook. Option 2 offers instructions for guiding your partners in sorting the data into spreadsheets themselves. See course for pros/cons of each option. |
| Option 1: | Map creators create a Worksheet for each partner organization within the Data Workbook. In each partner organization worksheet, map creators (interns are perfect for this) list map elements identified in the notecatchers and indicate the number of times mentioned (ie. If 2 notecatchers are generated from Preschool Classroom 1 and on each notecatcher students mention liking bright colors, the map element would be Bright Colors, and the frequency would be 2). |
| Option 2: | Map creators create a Worksheet for each partner organization within the Data Workbook. PARTNERS generate the data in their respective spreadsheet. We have outlined in each worksheet instructions for partners to enter the data generated from their Lesson 1 engagements with youth. This requires more time of your partners, but allows them to designate initial categories and code the data, and add additional information that may not be readily apparent from the notecatchers and drawings. We have set up the worksheets for Option 2. |
| Example: | 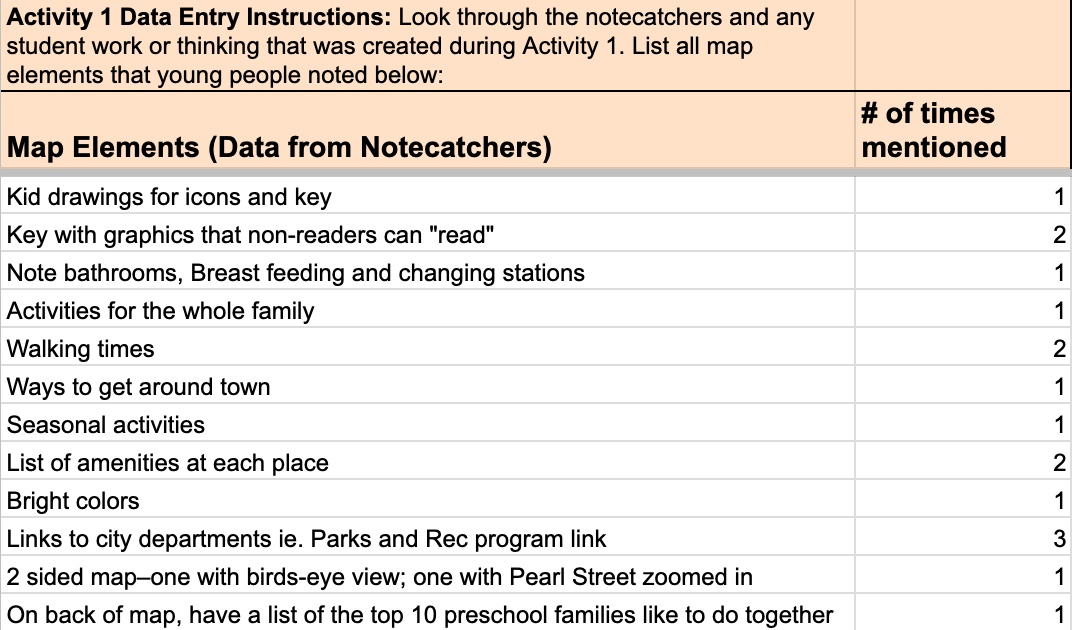 |
| Step 4: | Once you have gathered data from ALL of your contributing classrooms, non-profits, and other youth contributors, aggregate all of the "Map Element" data into a Raw Cumulative Map Elements Data worksheet. You can simply copy and paste the relevant rows and columns and add them to the sheet. |
| Example: | 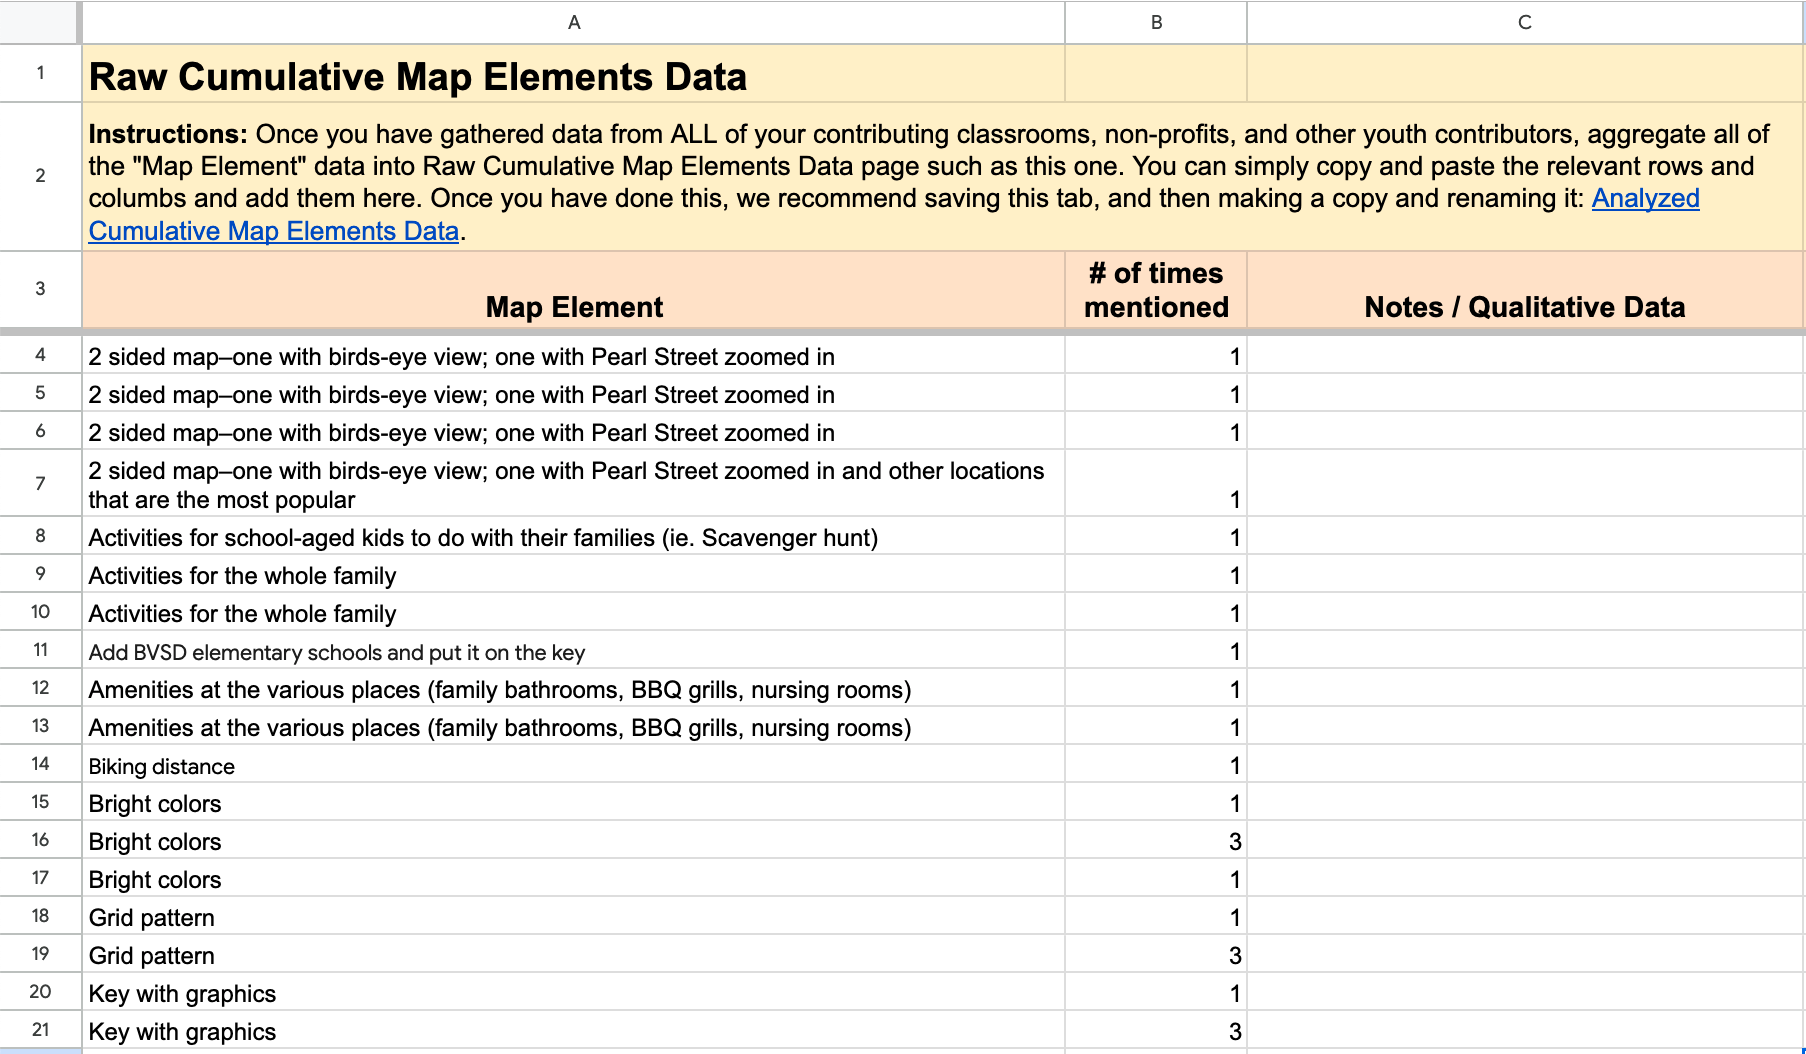 |
| Step 5: | Initial Coding: Copy the "Raw Cumulative Map Elements Data" worksheet and rename it as "Analyzed Cumulative Map Elements Data." As map creators, you will now sort this data by frequency and identify the map elements that children and youth have determined to be the most important elements to have in a map. Group similar elements into a unified category, then note how frequently they were mentioned (ie. Four different classrooms noted: bright colors, fun colors, patterns, we didn't like the boring colors. You might categorize those as "Colorful" or "Kid-Friendly Aesthetics" etc. And indicate how often they were noted). |
| Example: | 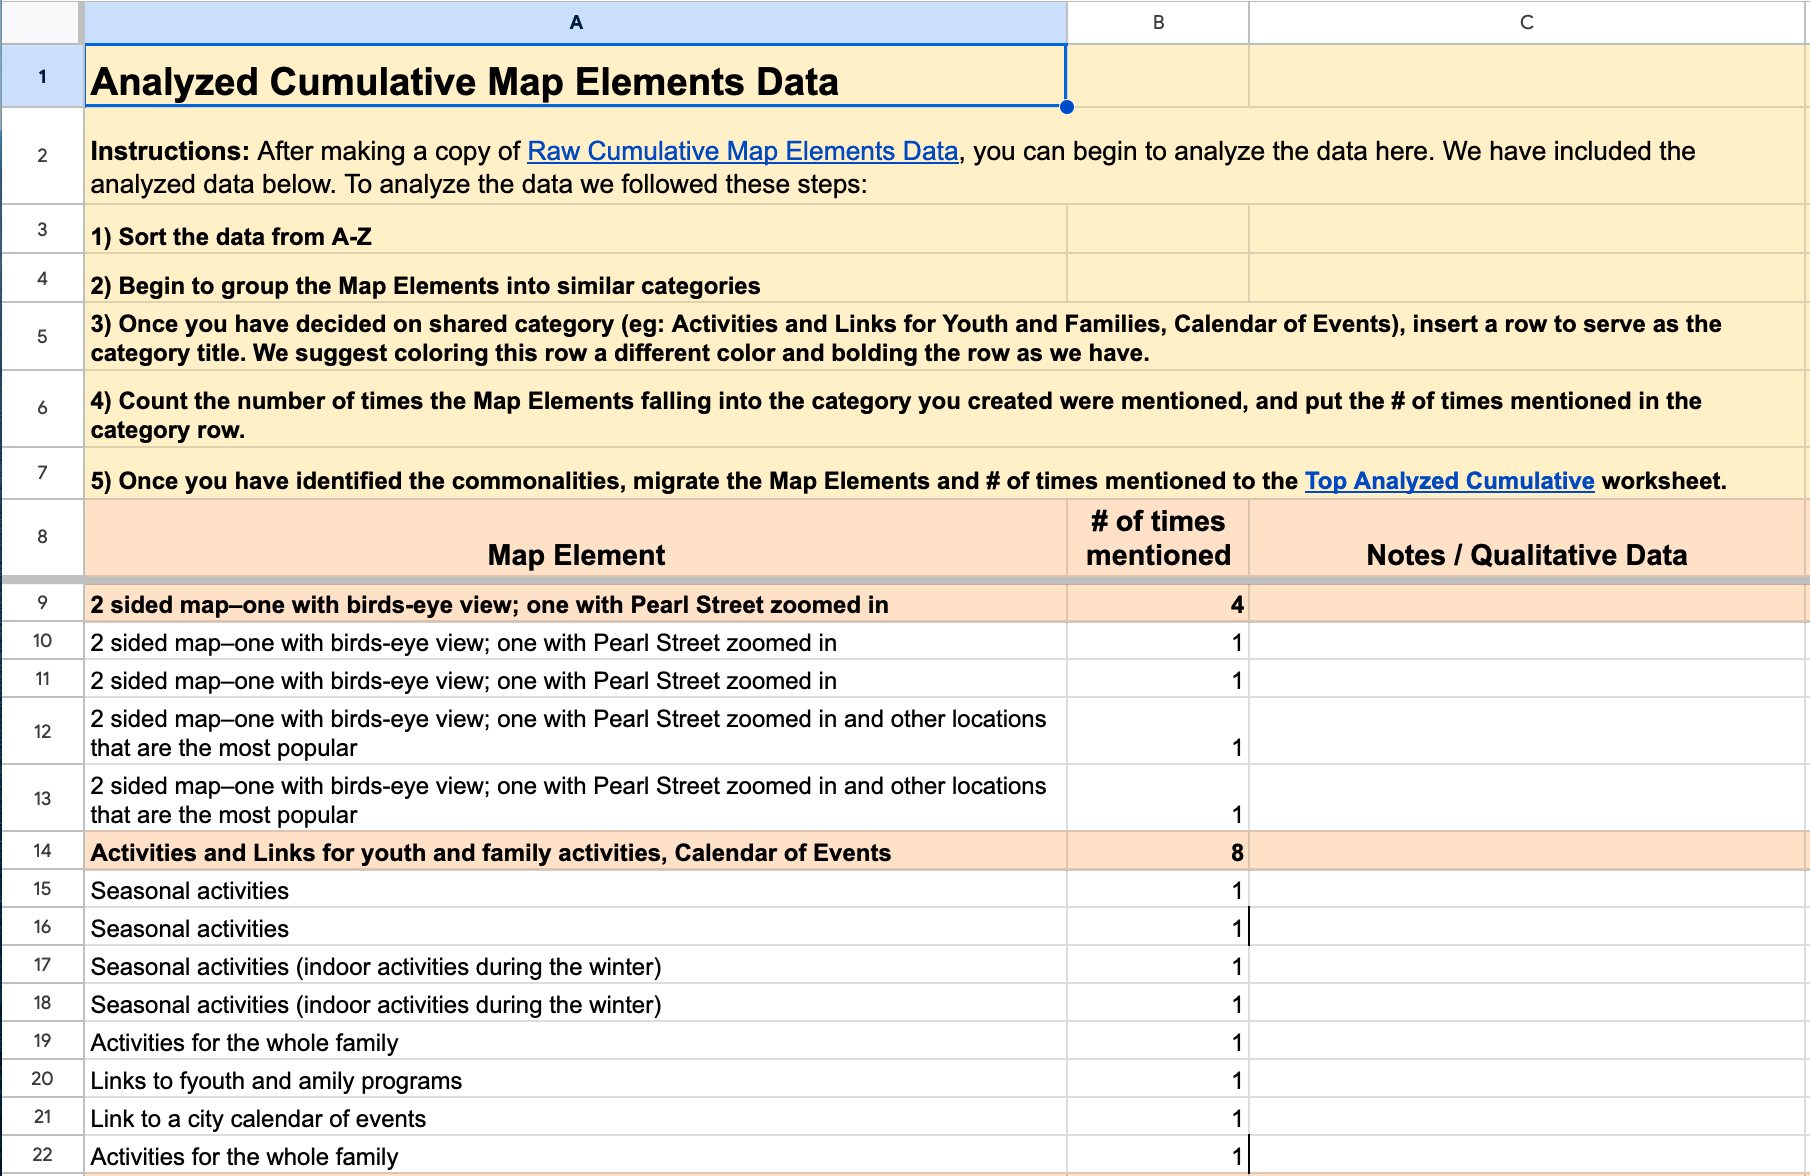 |
| Step 6: | Once you have coded the data, migrate the top Map Elements and # of times mentioned to the Top Analyzed Cumulative worksheet. |
| Example: | 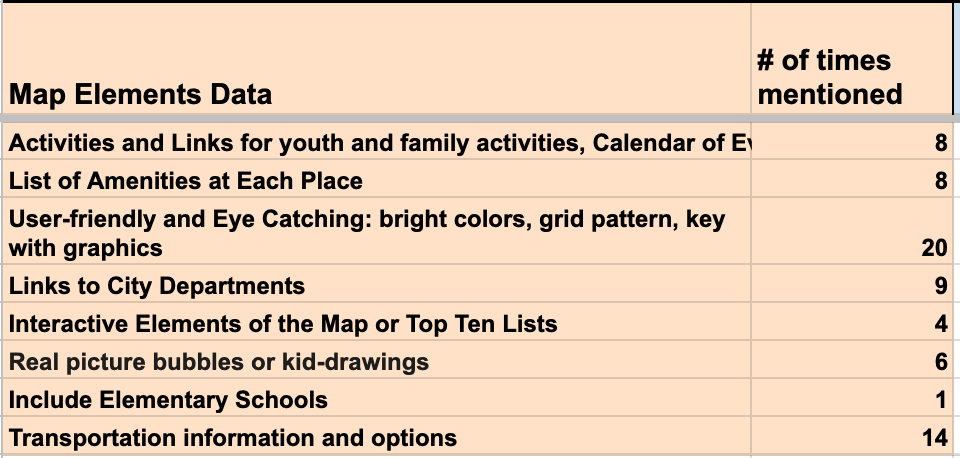 |